UGC is powerful — but only when you measure it correctly.
Many brands create UGC videos, run them as ads, and post them on social media…
but they have no idea which videos are performing and which ones are draining money.
Without tracking the right metrics, UGC becomes guesswork.
With the right KPIs, UGC becomes a sales engine.
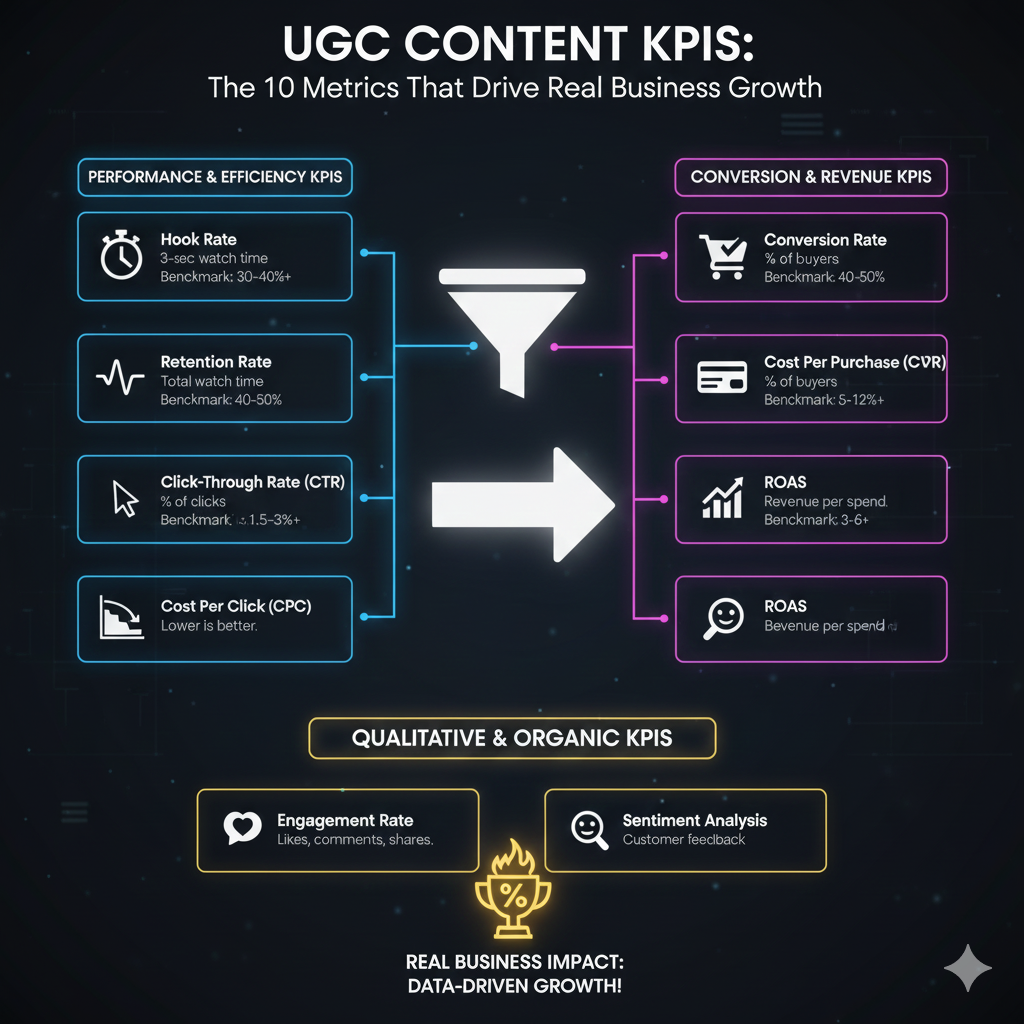
In this blog, you’ll learn the most important UGC KPIs that actually show the real business impact.
⭐ Why Measuring UGC Matters
UGC isn’t just content — it’s a performance asset.
By measuring UGC metrics, brands can:
- Identify high-performing creators
- Understand what type of content converts
- Reduce ad costs
- Improve creative testing
- Know exactly what drives purchases
- Stop wasting money on low-performing videos
UGC metrics give you clarity, direction, and control over your marketing outcomes.
⭐ 1. Hook Rate (First 3 Seconds Performance)
This is the most important metric for UGC ads.
Hook rate shows how many viewers kept watching after the first 3 seconds.
Why it matters:
The first 3 seconds decide:
- If someone watches the video
- If the ad spends efficiently
- If the video goes viral
- If you get conversions
A strong hook rate = strong sales potential.
Ideal benchmark:
- 30%+ is strong
- 40%+ is excellent
⭐ 2. Watch Time / Retention Rate
This shows how long people are watching your UGC video.
Higher watch time = higher engagement = lower ad cost.
Why it matters:
- The algorithm boosts videos with high retention
- Longer watch time increases trust
- Viewers understand your product better
- Higher retention leads to better conversions
UGC videos with clear storytelling or relatable moments perform best.
Ideal benchmark:
- 20–30% retention: Average
- 40–50% retention: Good
- 60%+ retention: Viral-level quality
⭐ 3. Click-Through Rate (CTR)
CTR shows how many people clicked on your ad after watching the UGC video.
Why it matters:
- Indicates audience interest
- Shows effectiveness of messaging
- Impacts ad cost
- Directly influences conversions
UGC formats that boost CTR:
- Problem–solution
- Before/after
- Quick testimonial
- POV usage
Ideal benchmark:
- 1%+ acceptable
- 1.5%+ good
- 2%–3% excellent
⭐ 4. Conversion Rate (CVR)
This measures how many people bought the product after clicking on the UGC ad.
UGC with strong storytelling + emotional appeal produces the best CVR.
Why it matters:
- Shows buying intent
- Reflects clarity of message
- Indicates product fit
- Helps predict revenue
Ideal benchmark:
- 2–5% for eCommerce
- 5–12% for high-trust UGC
- 15%+ for retargeting UGC
⭐ 5. Cost Per Click (CPC)
If your CPC is high, the UGC creative isn’t engaging enough.
UGC ads reduce CPC because they blend into the feed naturally.
Ideal benchmark:
- ₹2–₹7 for reels ads
- ₹5–₹12 for feed ads
⭐ 6. Cost Per Add-to-Cart (CPATC)
This shows how many people showed purchase intent after watching your UGC.
Lower CPATC = stronger UGC.
High CPATC = weak UGC (or wrong audience targeting).
UGC that performs best:
- Before/after
- Demo videos
- Pain-point hooks
⭐ 7. Cost Per Purchase (CPP)
This is the true performance indicator.
CPP tells you how much you pay for each customer.
Why it matters:
- Direct impact on profitability
- Helps choose winning UGC videos
- Shows scaling potential
- Builds confidence in creative testing
UGC often reduces CPP by 40–60% compared to studio ads.
⭐ 8. ROAS (Return on Ad Spend)
Ultimately, ROAS tells the REAL story.
UGC boosts ROAS because:
- It builds trust
- Converts cold audiences
- Reduces ad fatigue
- Feels relatable
- Shows real product results
Ideal benchmark:
- ROAS 2+ = good
- ROAS 3–6 = strong
- ROAS 6+ = scaling-level UGC
⭐ 9. Engagement Rate (for organic UGC)
Engagement includes:
- Likes
- Comments
- Shares
- Saves
- Replies
UGC with storytelling, humor, voiceover, or POV performs best organically.
High engagement = higher reach.
⭐ 10. Sentiment Analysis (What People Say)
Reading comments helps identify:
- Objections
- Product doubts
- Emotional triggers
- Customer expectations
This feedback can be used to:
- Improve scripts
- Improve products
- Create better ads
⭐ Conclusion
UGC is not guesswork — it’s data-driven creativity.
If you measure the right KPIs, you will know exactly which UGC videos to scale, which creators to retain, and which scripts convert the best.
The brands winning in 2025 are the ones who:
- Track performance
- Test creatives
- Improve scripts
- Analyze results
- Scale winning UGC
Measuring UGC is the difference between “posting content” and “growing a brand.”
⭐ CTA — Want UGC That Performs and Converts?
If you want UGC videos that deliver high hook rates, higher retention, lower ad costs, and strong ROAS, reach out to Creator Navigator.
We create performance-focused UGC for ads, websites, funnels, and social media.